Did the era of cheap money just end in Japan?
Japan's 10-year yield is at 3.1%, the highest since 1996. This month US 10-year yields hit their highest since 2002 and real yields since 2008, while stocks sit near records. In oil, a physical barrel traded $33 above the futures price.
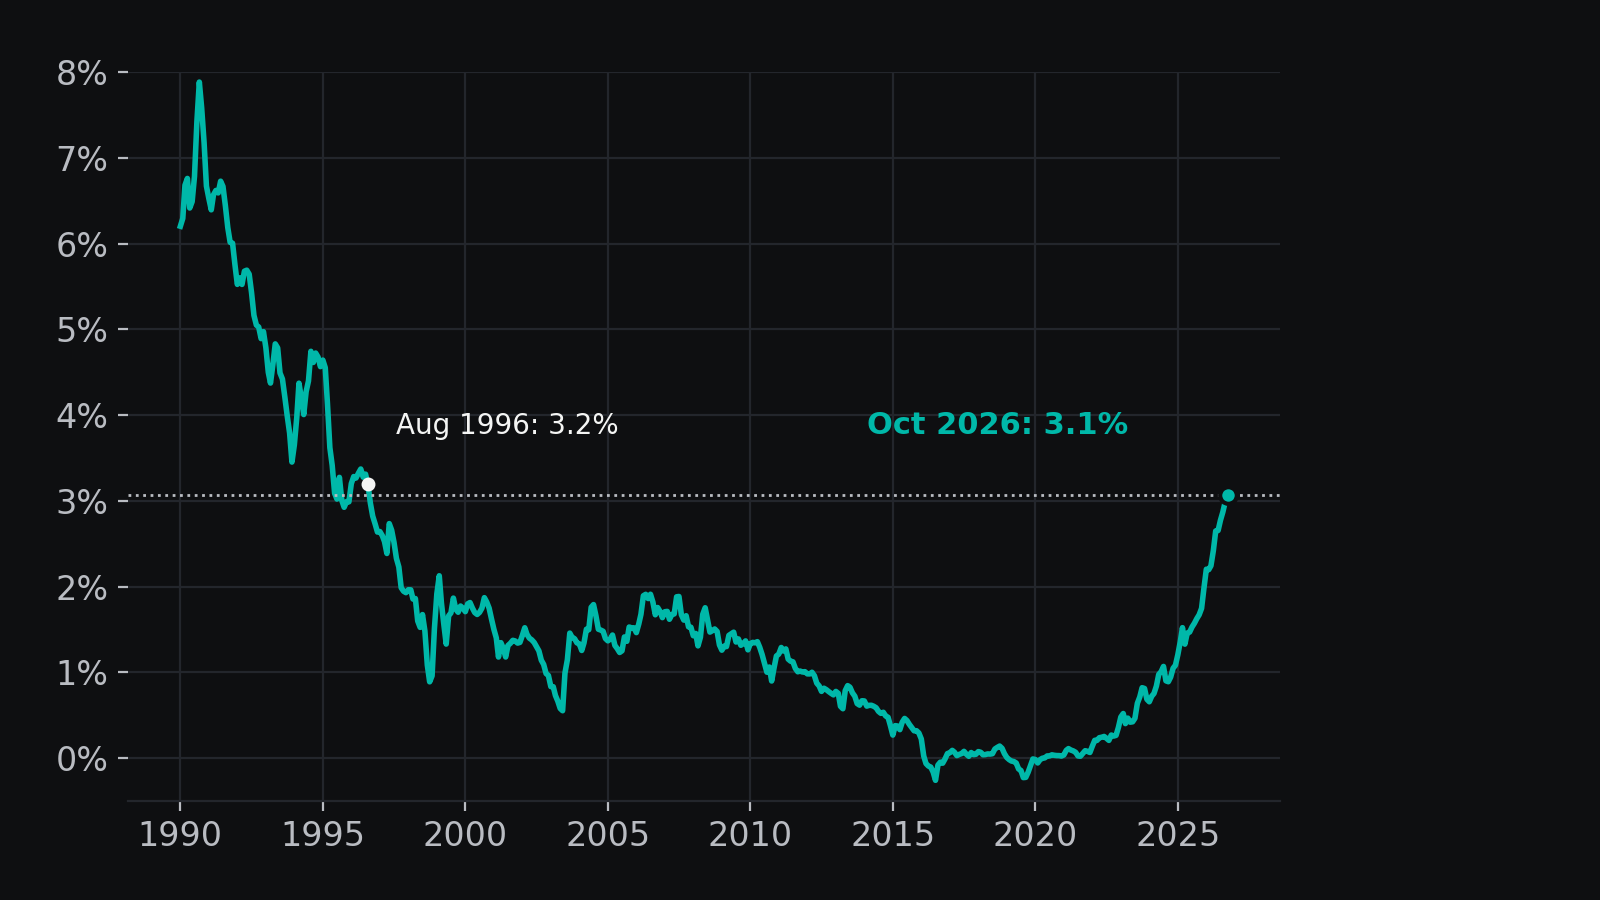
Japan spent almost 30 years with rates near zero. Japanese savings that found no return at home flowed out into the world: in January 2023 Japan was the largest foreign holder of US Treasuries, with $1.1 trillion. Japan's 10-year yield, 1.7% a year ago, touched 3.11% on 7 October. With 3% available at home, the case for keeping that money abroad is getting weaker.
Japan is not alone
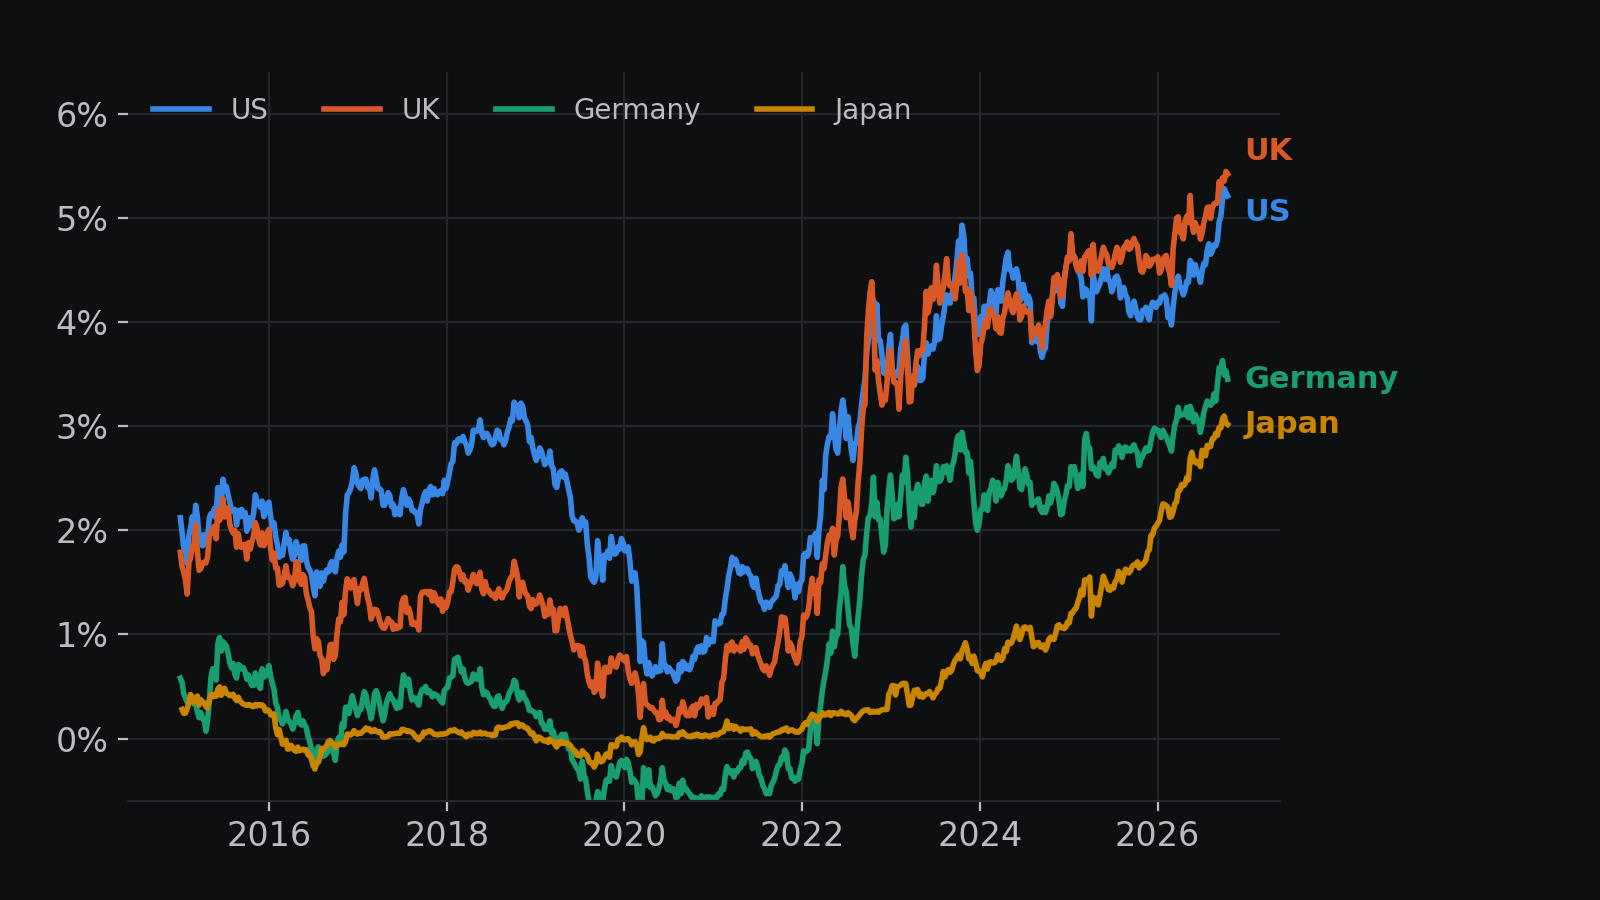
- The US 10-year yield reached 5.31% on 5 October, the highest since May 2002.
- The UK (5.48% on 8 October) and Germany (3.69% on 28 September) hit their highest since our data begins in 2015.
The detail that matters is in the US: almost all of the rise comes from the real yield. The 10-year real yield went from 1.75% to 2.88% in a year (2.95% on 5 October, the highest since November 2008). The market's 10-year inflation expectation moved from 2.30% to 2.35% over the same year, barely at all. The market is not saying "inflation is coming". Money itself is getting more expensive.
Meanwhile the S&P 500 and the Nasdaq set records on 6 October and on 14 October were only 1.3% and 3.3% below those peaks. Bonds are pricing the most expensive money since 2008; stocks sit at highs as if money were still cheap. Can both last at the same time? That is the most important question we are watching.
Oil has two prices
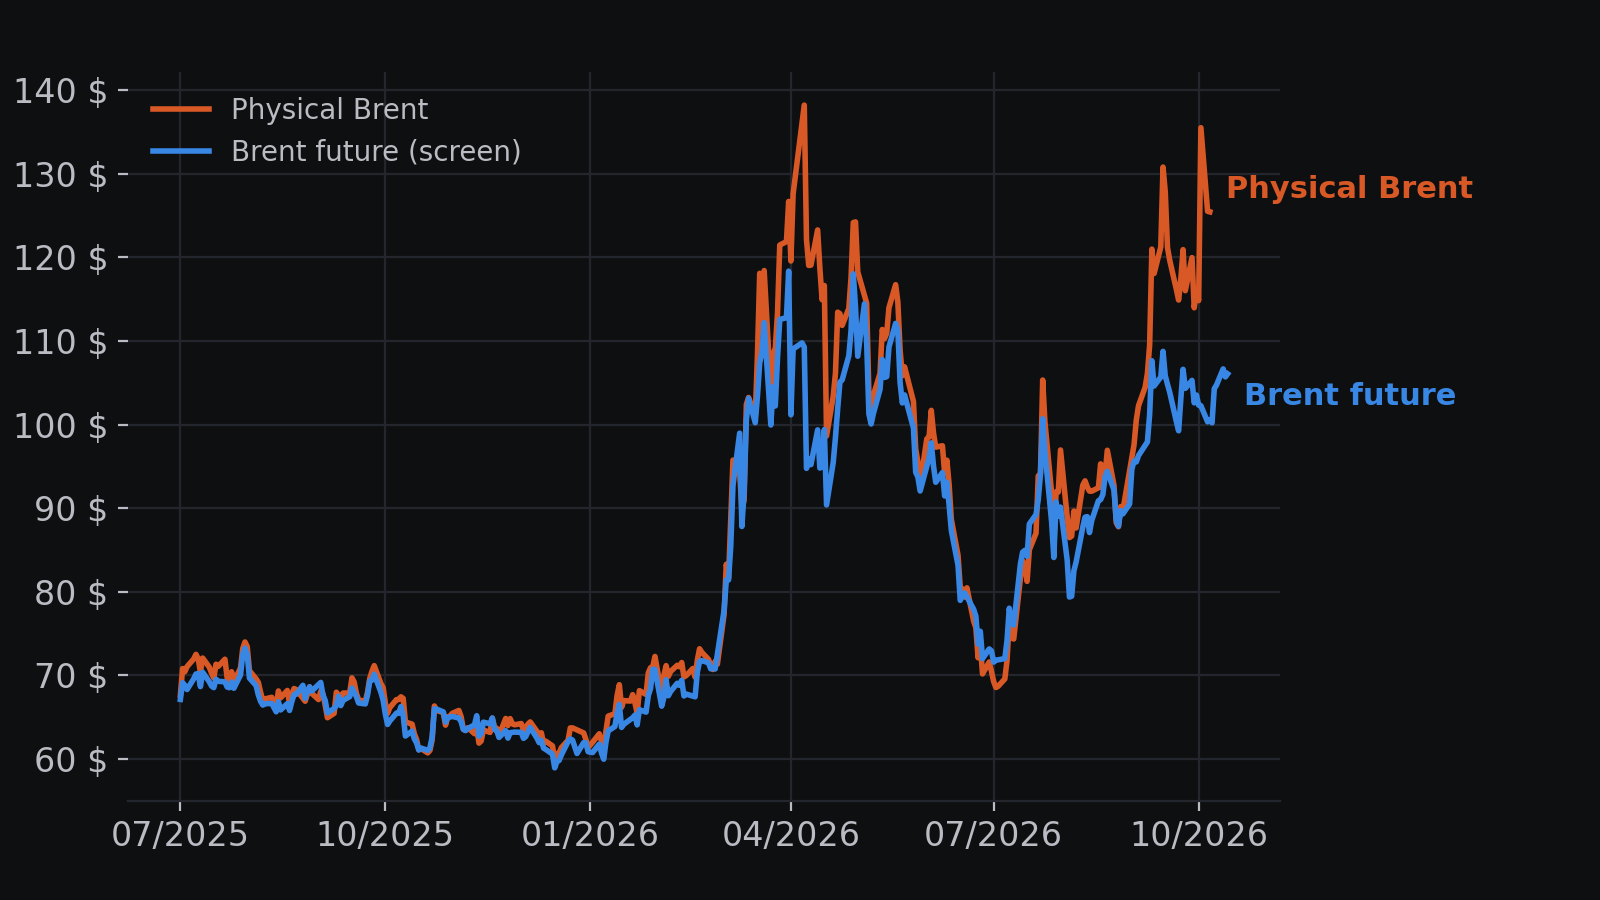
The Brent price you see on screens (the futures contract) was $106 on 14 October. The price of an actual barrel today (physical Brent) was $125 on 6 October. The gap reached $33 on 2 October. Between 2015 and 2025 it averaged close to zero and peaked at $11.1.
The reason is geography: about 4 ships a day are crossing the Strait of Hormuz, against an average of 92 in 2023. The futures price says "this will pass"; the physical price says "a barrel is hard to find today". The bond market says the same thing: inflation expectations are flat, so the market treats the oil shock as temporary.
Three things we are watching
- Whether Japan's 10-year yield stays above 3%.
- Whether the US 10-year real yield reaches 3%.
- Whether the gap between physical and futures Brent closes.
Data: Japan Ministry of Finance (JGB), FRED (DGS10, DFII10, T10YIE, DCOILBRENTEU), Bank of England, Bundesbank, ICE Brent futures (Yahoo BZ=F), S&P 500 and Nasdaq (Yahoo ^GSPC, ^IXIC), IMF PortWatch, US Treasury TIC; as of 15 October 2026. Charts are weekly/monthly; peaks quoted in the text are from daily data.
Data fingerprint: sha256:002fc38f3d29d539 · data as of 2026-10-15 · 247 series
This series reads macro conditions. It does not forecast the return of any asset, and nothing in it is a call to trade.
DATA JOURNALISM, NOT INVESTMENT ADVICE. InvestMuse provides analytical and backtesting software for informational purposes only. It surfaces patterns in price, fundamentals, news sentiment, and historical analogues across 1,237 assets. No trade execution, no brokerage connectivity, no personalized investment recommendations, no trading signals. We do not issue ratings or targets. All output is educational. Decisions are yours. Past performance does not guarantee future results.