Chip stocks had their worst week in our data; India and Hong Kong rose
The US semiconductor index (SOX) fell 21.8% between 29 October and 5 November, its largest one-week fall since our data begin in 2015, including 12.2% on 5 November alone. Taiwan fell 10.3% and Korea 9.3%; in the same week India's NIFTY 50 rose 7.0% and Hong Kong's Hang Seng 8.0%.
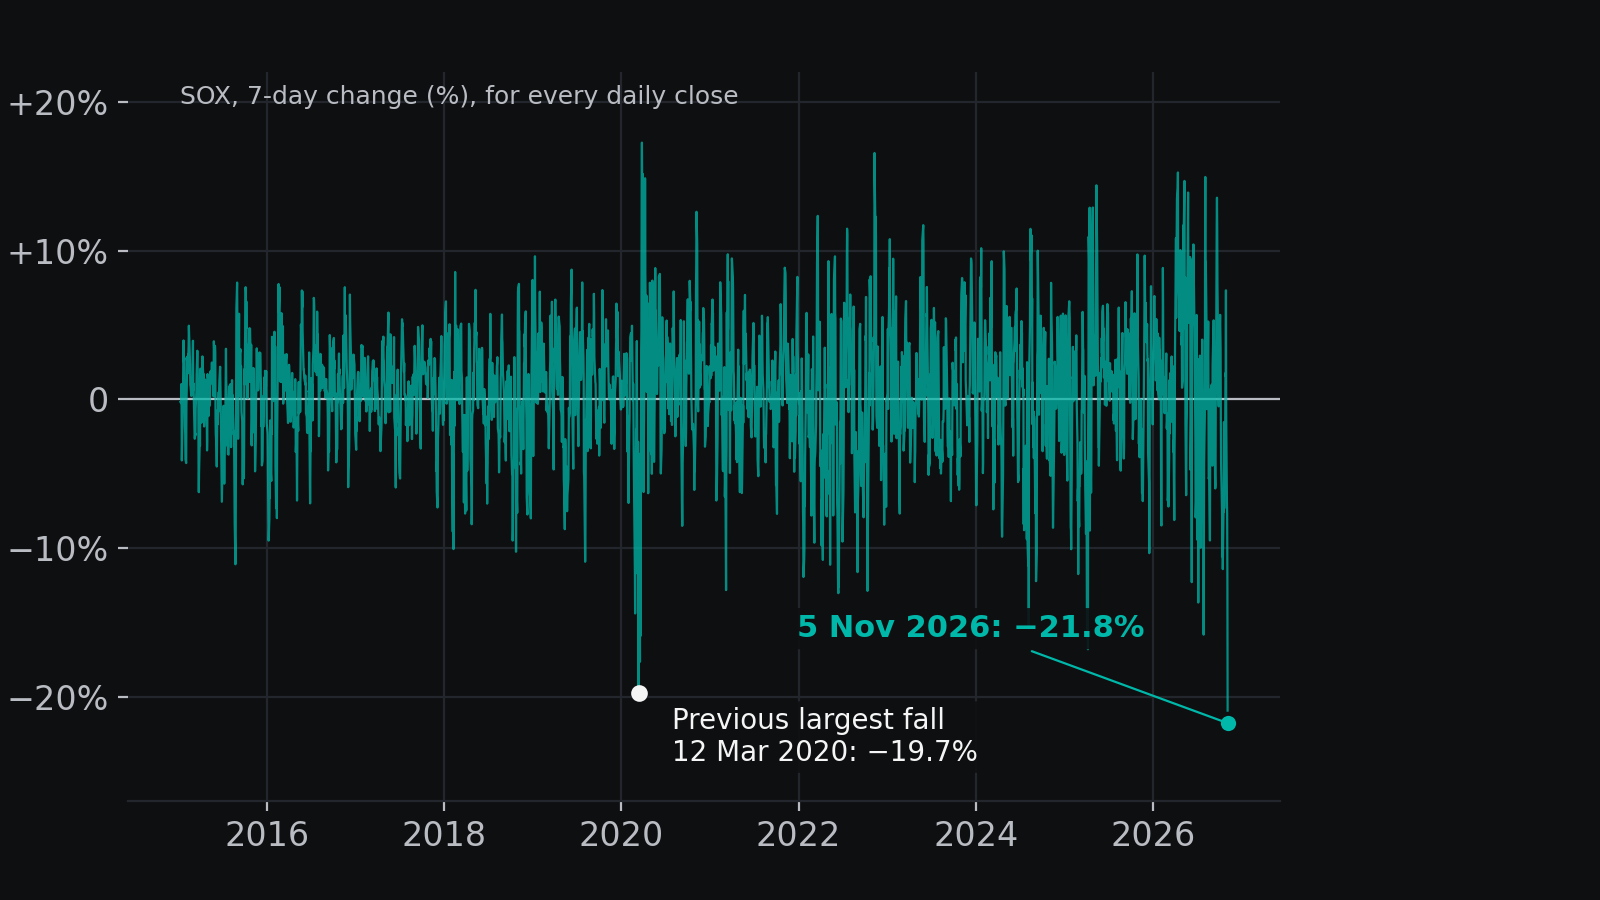
The US semiconductor index, the SOX, fell 21.8% between 29 October and 5 November 2026. That is its largest one-week fall since our data begin in 2015; the previous largest was 19.7% in the week to 12 March 2020. In our 23 October issue the SOX was 26.7% below its 22 June record (22 October close). On 5 November the gap had widened to 38.4%, and the index posted its lowest close since 10 April.
12% in a single day
Most of the fall came on 5 November, when the SOX dropped 12.2% in one session, its steepest daily fall since 16 March 2020 (15.9%). The same day the Nasdaq fell 5.5% and the S&P 500 4.4%. The VIX volatility index went from 17.2 on 29 October to 28.2 on 5 November, its highest close since 30 March.
Over the whole week the broad market lagged far behind the chips: the Nasdaq fell 7.1% and the S&P 500 4.7%.
Why?
We are not offering our own explanation; this is the reading that led the coverage. According to Fox Business on 5 November, markets priced in the US midterm results as investors weighed what they could mean for AI regulation. The report says data centres' effect on electricity prices had become a campaign issue, with some politicians calling for limits or pauses on new projects. eToro analyst Jakub Rochlitz said the market's interpretation is that the AI infrastructure build-out will become slower and more expensive. Argent Capital's Jed Ellerbroek told Reuters the magnitude of the moves was "outsized".
Asia split in two
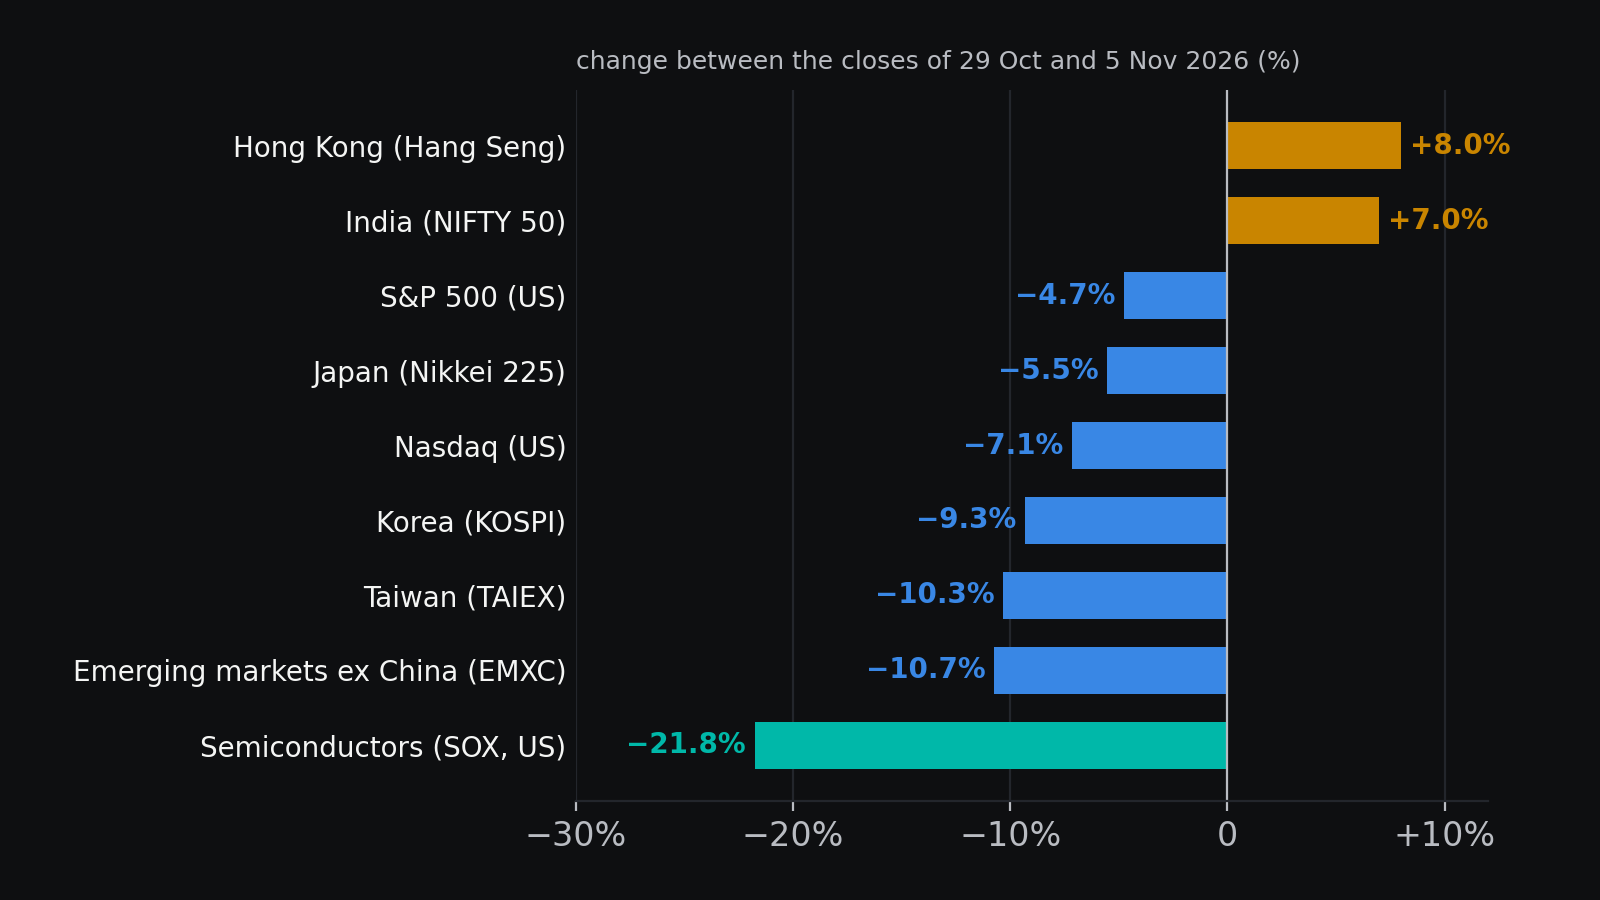
Chip-heavy Asian markets fell with the SOX: Taiwan's TAIEX was down 10.3% and Korea's KOSPI 9.3%. EMXC, the fund that tracks emerging-market stocks outside China, lost 10.7%, its largest one-week fall since March 2020.
In the same week two large Asian markets went the other way. India's NIFTY 50 rose 7.0%, its largest one-week rise since February 2021. Hong Kong's Hang Seng rose 8.0%, its largest one-week rise since April 2025.
The split fits the structure of the data. Since 2015, on 13-week changes, the markets that move most closely with the SOX are Taiwan (correlation 0.84) and Korea (0.76). For India the link is 0.40, for Hong Kong 0.36. This week the closely linked markets fell with the chips, and the two loosely linked ones rose.
What happened before
This is not a forecast but a comparison from our own data. Since 2015 there are 8 separate episodes in which the SOX's 7-day fall exceeded 12% (only the deepest in each 30-day cluster counts). In 7 of those 8 the index was higher four weeks later, with a median change of +10.7%. Thirteen weeks later it was higher in 6 of 8, median +16.6%. Two exceptions: 13 weeks after the June 2022 fall the SOX was still 4.7% lower, and 2.3% lower after the June 2026 fall. After the previous largest case, 12 March 2020, the index rose 15.1% in four weeks and 34.8% in thirteen.
Eight cases are few. The SOX is an index of the companies that survived, and this week's fall is larger than all eight. The past is no guarantee of what follows.
The weeks ahead: two paths
The first two paragraphs of this section are our reading, not a measurement. The record above points to a rebound in the short run, but the kind of fall matters. The falls of March 2020 and April 2025 were shocks and closed quickly: thirteen weeks later the SOX was 34.8% and 58.3% higher. This week's explanation in the press is structural instead: a slower AI build-out. In that respect it looks more like 2022. Four weeks after the June 2022 fall the index was 4.9% lower, and 4.7% lower after thirteen. 2026 is also a weak cluster: this is the third time this year the SOX has fallen more than 12% in seven days (June, July, November).
Who the market punished is a clue too. At the 5 November close, chip-equipment maker Applied Materials stood 55.8% below its 52-week high and Lam Research 57.3% below; Vistra and Constellation Energy, which sell power to data centres, were 40.6% and 36.4% below theirs. Microsoft, one of the biggest AI spenders, was only 3.6% from its high. Our reading: the market is pricing slower spending, which hits the sellers' revenue first. If Microsoft starts to fall hard as well, the story has moved from capital spending to a general risk sell-off; if Vistra and Constellation recover, the regulatory fear is easing.
With this issue we register three projections. The probabilities come from the base rates in our own data (adjusted for the small sample); each will be scored right or wrong on its date:
- The SOX closes above its 5 November close on 3 December: 80% (higher four weeks later in 7 of the 8 episodes above).
- The SOX closes above its 5 November close on 4 February 2027: 70% (higher thirteen weeks later in 6 of 8).
- The VIX closes below 25 on 3 December: 77% (in 9 of the 11 times since 2015 that the VIX jumped above 28 from a calm stretch, it was below 25 four weeks later).
Five things we are watching
- US consumer prices for October, due on 10 November.
- Applied Materials' quarterly results on 12 November: the first hard sign of slower spending in equipment orders.
- Nvidia's quarterly results on 17 November: the signal on its biggest customers' spending plans.
- The Macro Weather reading for the week ending 6 November: the interim reading is −0.24, inside the Calm band (0.27 the week before).
- Money flow: in the week to 30 October it moved to "pull toward the dollar during risk aversion"; its risk-appetite score (B) fell from 0.19 to −0.19 in one week, with an interim reading of −0.43.
Data: Yahoo (^SOX, ^IXIC, ^GSPC, ^VIX, ^TWII, ^KS11, ^N225, ^NSEI, ^HSI, EMXC); InvestMuse GeoPulse Macro Weather and Money flow; US CPI calendar from the BLS; the reading of the fall's cause from Fox Business (5 November 2026) and Reuters; company dates from the Applied Materials (22 October) and Nvidia (28 October) announcements; distance from the 52-week high from InvestMuse price data; as of 6 November 2026. Index data are 5 November closes; Asian closes come before the US session of the same day. Weekly and daily changes are an InvestMuse calculation on daily closes since 2015 (EMXC since 2017, price only).
Projections
Dated, checkable projections about macro conditions and indices, with probabilities from the base rates in our own data — never a price level for an asset, never a call to trade. Each one is checked in public on its stated date and its outcome is updated here.
- OpenP-0006-1Made 6 November 2026Check 3 December 2026
The SOX closes above its 5 November 2026 close on 3 December 2026.
- OpenP-0006-2Made 6 November 2026Check 4 February 2027
The SOX closes above its 5 November 2026 close on 4 February 2027.
- OpenP-0006-3Made 6 November 2026Check 3 December 2026
The VIX closes below 25 on 3 December 2026.
Data fingerprint: sha256:acd3915aa837cc9f · data as of 2026-11-06 · 294 series
This series reads macro conditions. Its projections are probabilities from our own data, scored in public; it gives no price level for any asset, and nothing in it is a call to trade.
DATA JOURNALISM, NOT INVESTMENT ADVICE. InvestMuse provides analytical and backtesting software for informational purposes only. It surfaces patterns in price, fundamentals, news sentiment, and historical analogues across 1,327 assets. No trade execution, no brokerage connectivity, no personalized investment recommendations, no trading signals. We do not issue ratings or targets. All output is educational. Decisions are yours. Past performance does not guarantee future results.