An 18-week Hot spell ends as chip stocks slide from their records
Macro Weather turned Calm in the week to 16 October after 18 weeks Hot: the W score fell from 0.70 to 0.04. The Philadelphia Fed manufacturing index fell from 47.4 in August to 20.9 in October. On 22 October the KOSPI was 39.3% and the SOX 26.7% below their 22 June records; the S&P 500 only 2.0% below its own.
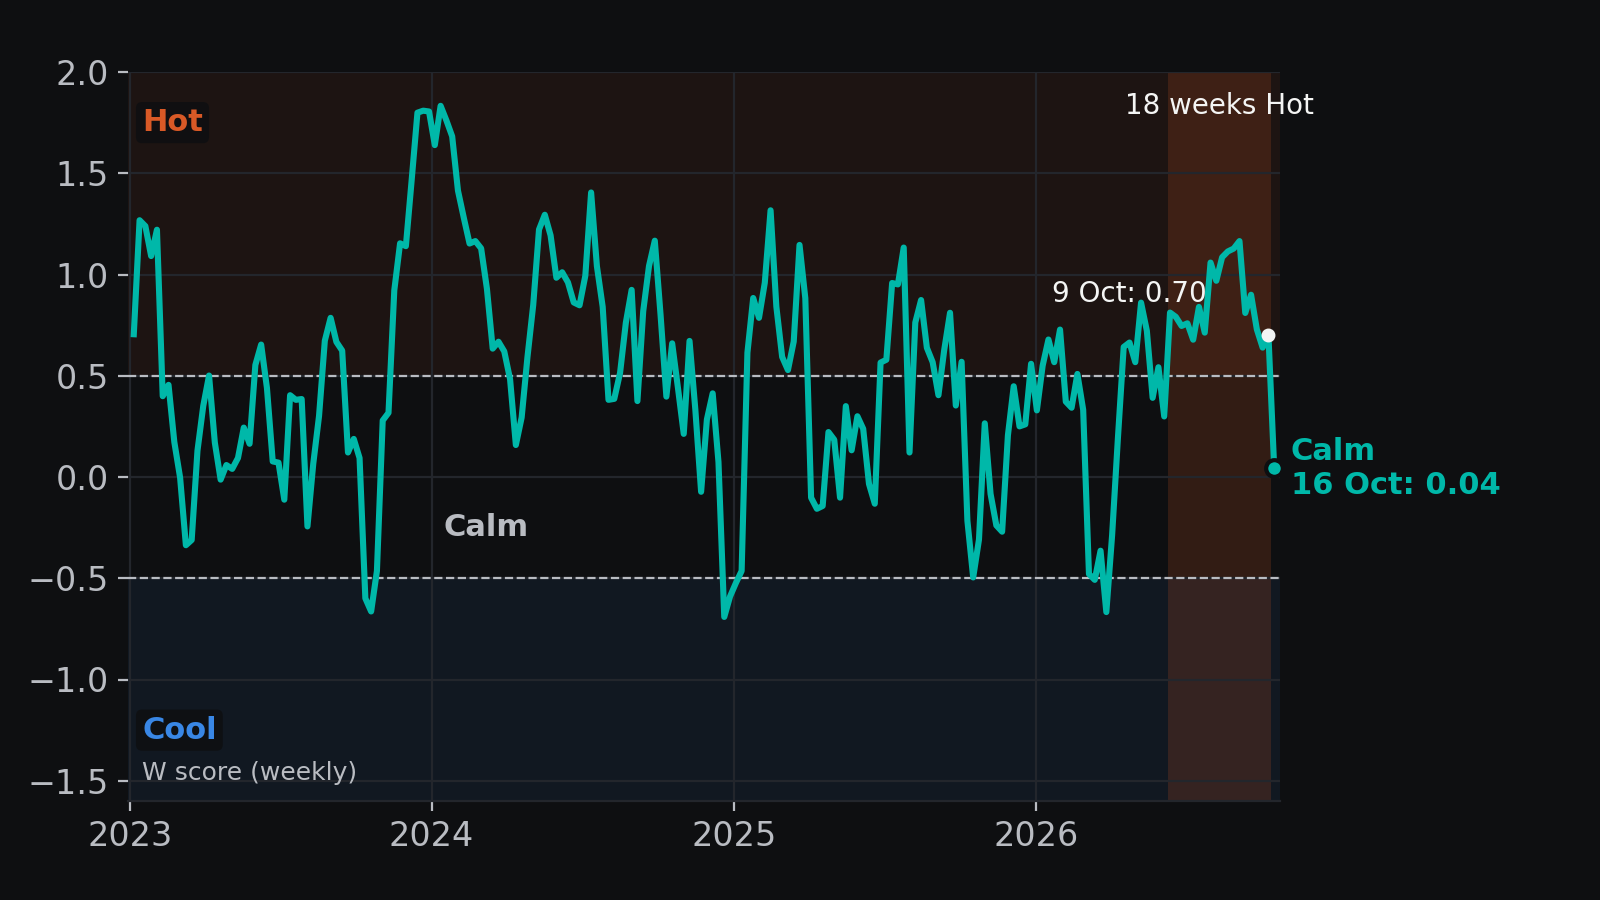
InvestMuse GeoPulse's Macro Weather had been Hot for 18 weeks (12 June to 9 October 2026). In the week to 16 October the W score fell from 0.70 to 0.04, into the Calm band (between −0.5 and +0.5). It was the largest weekly fall since 6 March. Since the reading begins in March 2020, a longer Hot spell has happened only once: 20 weeks from November 2023 to March 2024. A state typically lasts 2 weeks.
What cooled it?
Two things happened in the same week. The growth factor fell from 1.03 to 0.44, its sharpest weekly drop since 22 May. The biggest part came from the Philadelphia Fed manufacturing index: 47.4 in August, 37.8 in September, 20.9 in October, the lowest reading since June.
The stress factor rose from −0.94 to −0.36, its largest weekly rise since 5 June. Stock-market volatility carried it: the VIX was 14.8 on 9 October and 20.0 on 16 October, its highest close since 29 July. Credit barely moved: the Baa corporate bond spread went from 1.45 to 1.46 percentage points over the same week.
Chips are far from their records; the S&P 500 is close
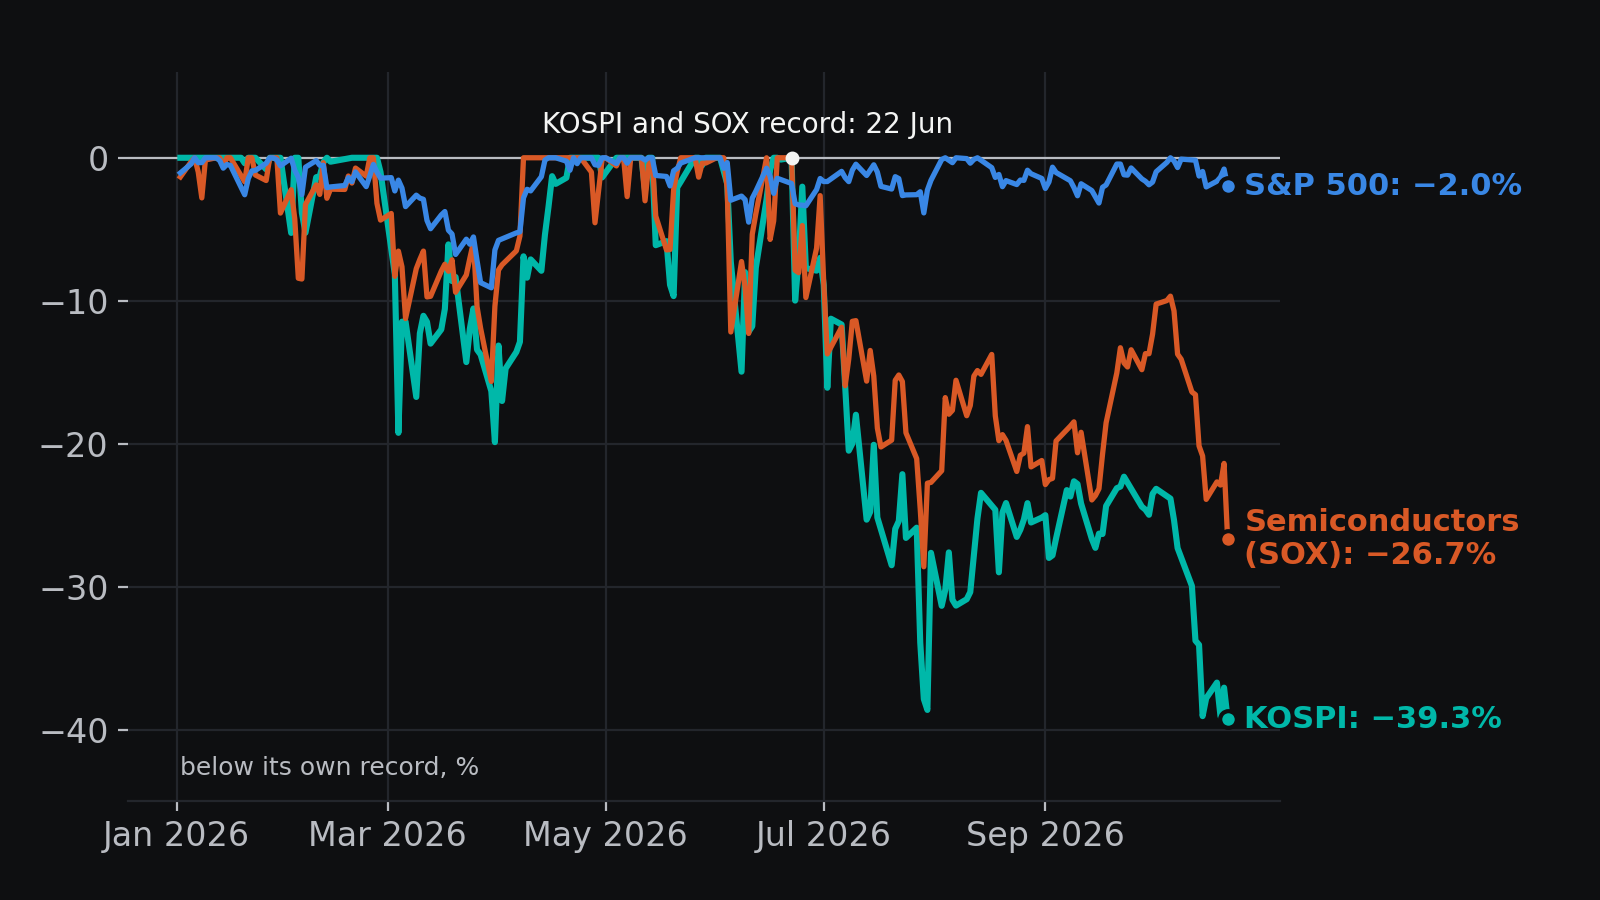
Korea's chip-heavy KOSPI and the US semiconductor index (SOX) both set their records on the same day, 22 June. On 22 October the KOSPI closed 39.3% below its record, its furthest from a record since March 2020 (our data begins in 2015). The SOX was 26.7% below. In the last four weeks alone the KOSPI fell 21.8% (23 September to 22 October) and the SOX 14.1% (24 September to 22 October).
The S&P 500, by contrast, set a record on 6 October and on 22 October was only 2.0% below it. It is 2.6% higher than on 22 June. In four months the picture split: the S&P 500 is 2% from its record, the KOSPI 39%.
The turn in Macro Weather came in the same week as this split. As long as the credit spread stays calm, this is so far a week of volatility. The weaker growth side comes from one survey, and the next print will test it.
Three things we are watching
- The Macro Weather reading for the week ending 23 October: the interim reading on 23 October is 0.28, inside the Calm band.
- The FOMC rate decision on 28 October.
- The Philadelphia Fed manufacturing index for November, due 19 November: 20.9 in October.
Data: InvestMuse GeoPulse Macro Weather (weekly, 11 inputs); FRED (GACDFSA066MSFRBPHI, BAA10Y); Yahoo (^VIX, ^KS11, ^SOX, ^GSPC); as of 23 October 2026. Index data are 22 October closes; distance from record is an InvestMuse calculation on daily closes since 2015.
Data fingerprint: sha256:36b98048810027fe · data as of 2026-10-23 · 247 series
This series reads macro conditions. It does not forecast the return of any asset, and nothing in it is a call to trade.
DATA JOURNALISM, NOT INVESTMENT ADVICE. InvestMuse provides analytical and backtesting software for informational purposes only. It surfaces patterns in price, fundamentals, news sentiment, and historical analogues across 1,241 assets. No trade execution, no brokerage connectivity, no personalized investment recommendations, no trading signals. We do not issue ratings or targets. All output is educational. Decisions are yours. Past performance does not guarantee future results.