InvestMuse Blog
How InvestMuse Transforms Investment Analysis: From Daily Hot Picks to AI-Powered Financial Insights
The Problem Every Investor Faces
Sarah, a marketing manager with a growing investment portfolio, starts her day like millions of other investors worldwide. She opens her laptop, checks the market, and immediately feels overwhelmed. TradingView shows her charts, but interpreting the technical indicators requires expertise she doesn’t have. Financial news websites flood her with conflicting opinions. Yahoo Finance displays basic numbers, but connecting the dots between a company’s financial health and its investment potential feels like solving a puzzle with missing pieces.
Sound familiar? You’re not alone. The investment world has always been divided into two camps: those with access to expensive institutional tools and professional analysis, and everyone else making decisions with limited, fragmented information.
Enter InvestMuse: Your AI-Powered Investment Intelligence Platform
What if you could wake up each morning to find that a team of quantitative analysts, technical experts, and AI specialists had already done the heavy lifting for you? What if complex financial data could be transformed into clear, visual insights that guide your investment decisions with confidence?
This is exactly what InvestMuse delivers: a revolutionary platform that brings Wall Street-level analysis to your fingertips.
Starting Your Day with AI-Curated Opportunities
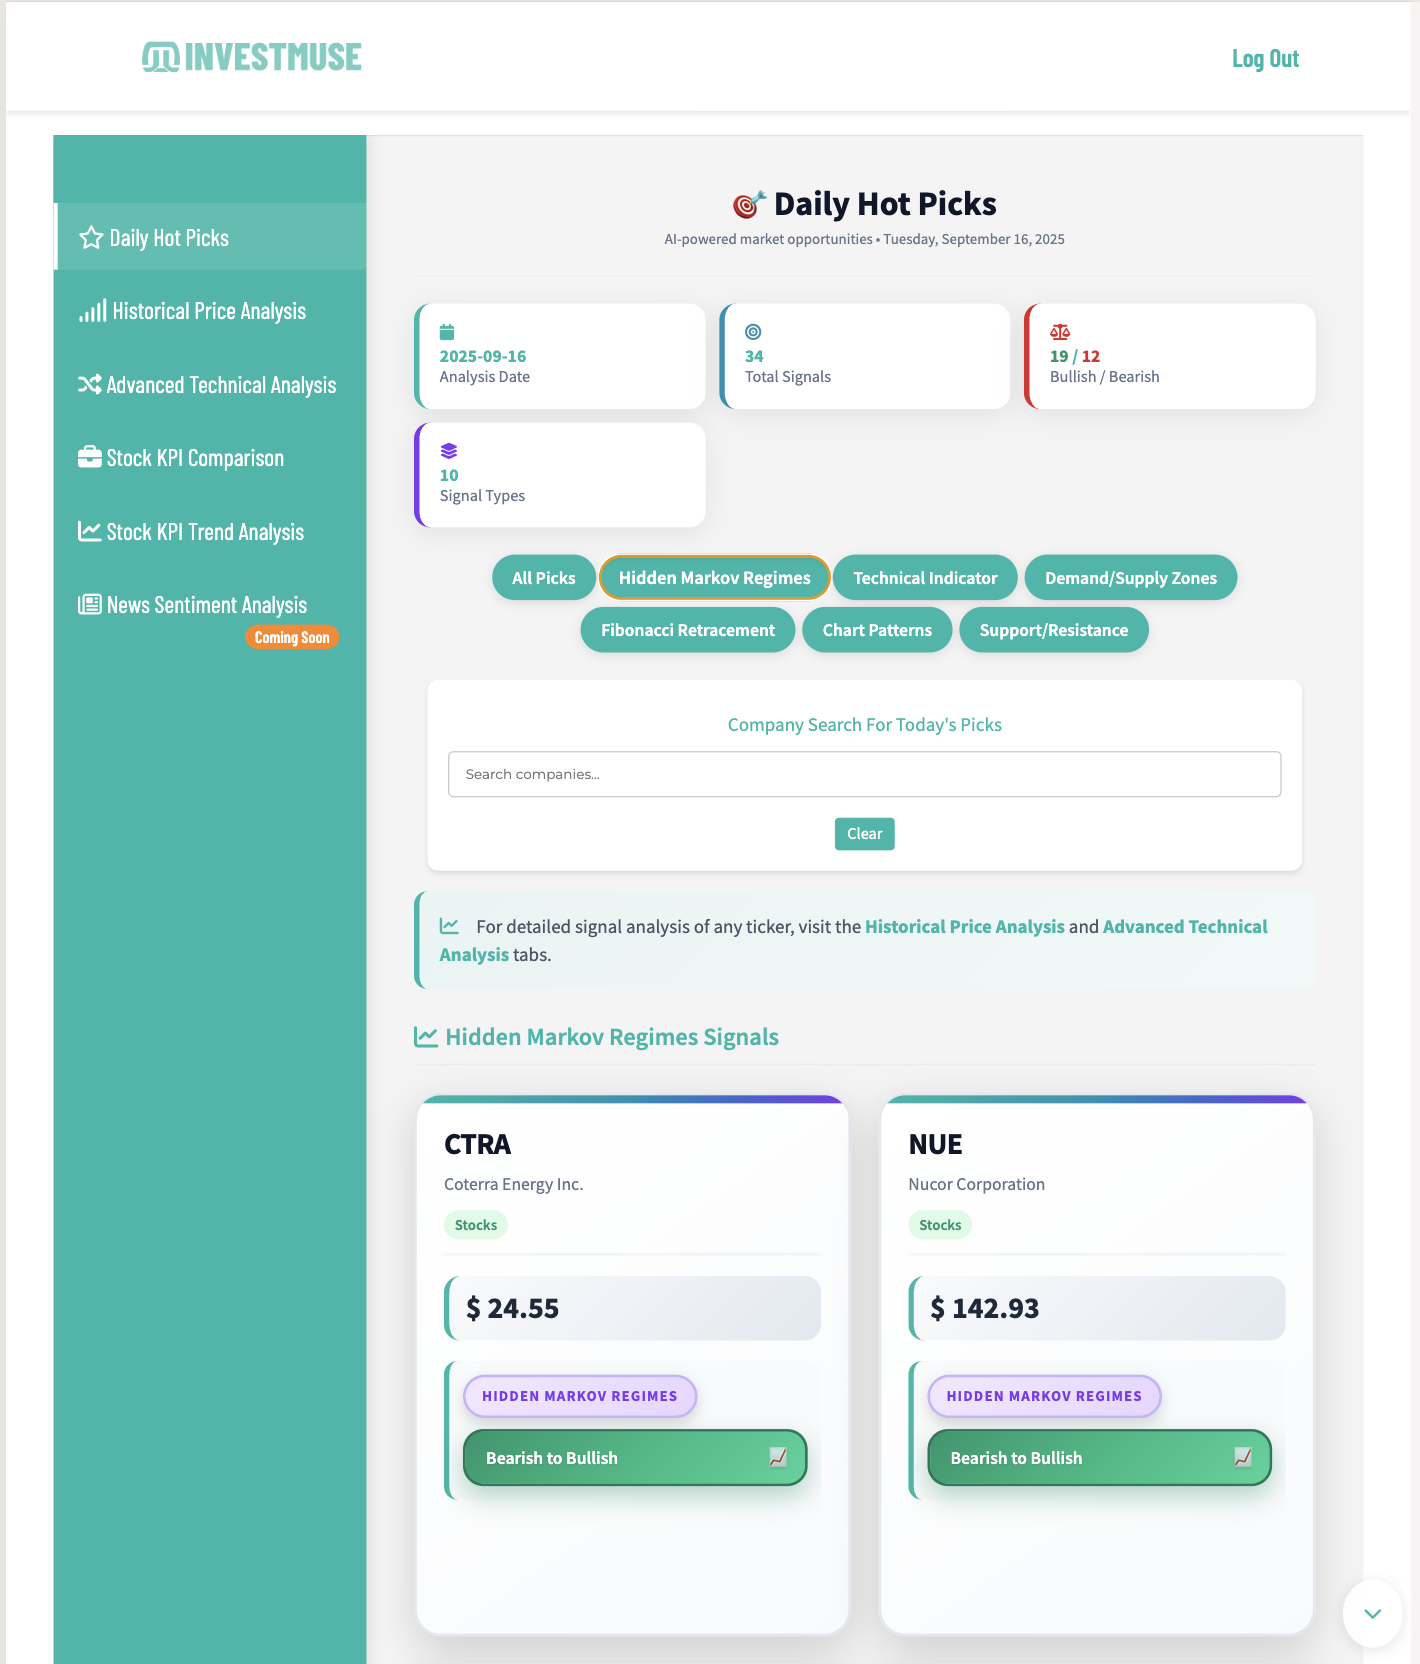
Every morning at GMT, InvestMuse’s sophisticated algorithms scan thousands of assets, applying multiple analytical frameworks to surface the most promising opportunities of the day. The Daily Hot Picks feature isn’t just another stock screener, it’s your personal research team working 24/7.
The platform analyzes daily OHLCV data through various lenses:
- Relative volume patterns that signal unusual market interest
- Technical indicators showing momentum shifts
- Overbought/oversold conditions revealing potential reversals
- Fibonacci retracements identifying key support and resistance levels
- Chart formations signaling breakout opportunities
Instead of drowning in data, you see a curated selection of assets that meet rigorous analytical criteria. Want to focus on a specific type of opportunity? Simply filter by analysis type. Looking for a particular symbol? The search function instantly shows if it’s among today’s hot picks.
Deep-Dive Analysis Made Simple
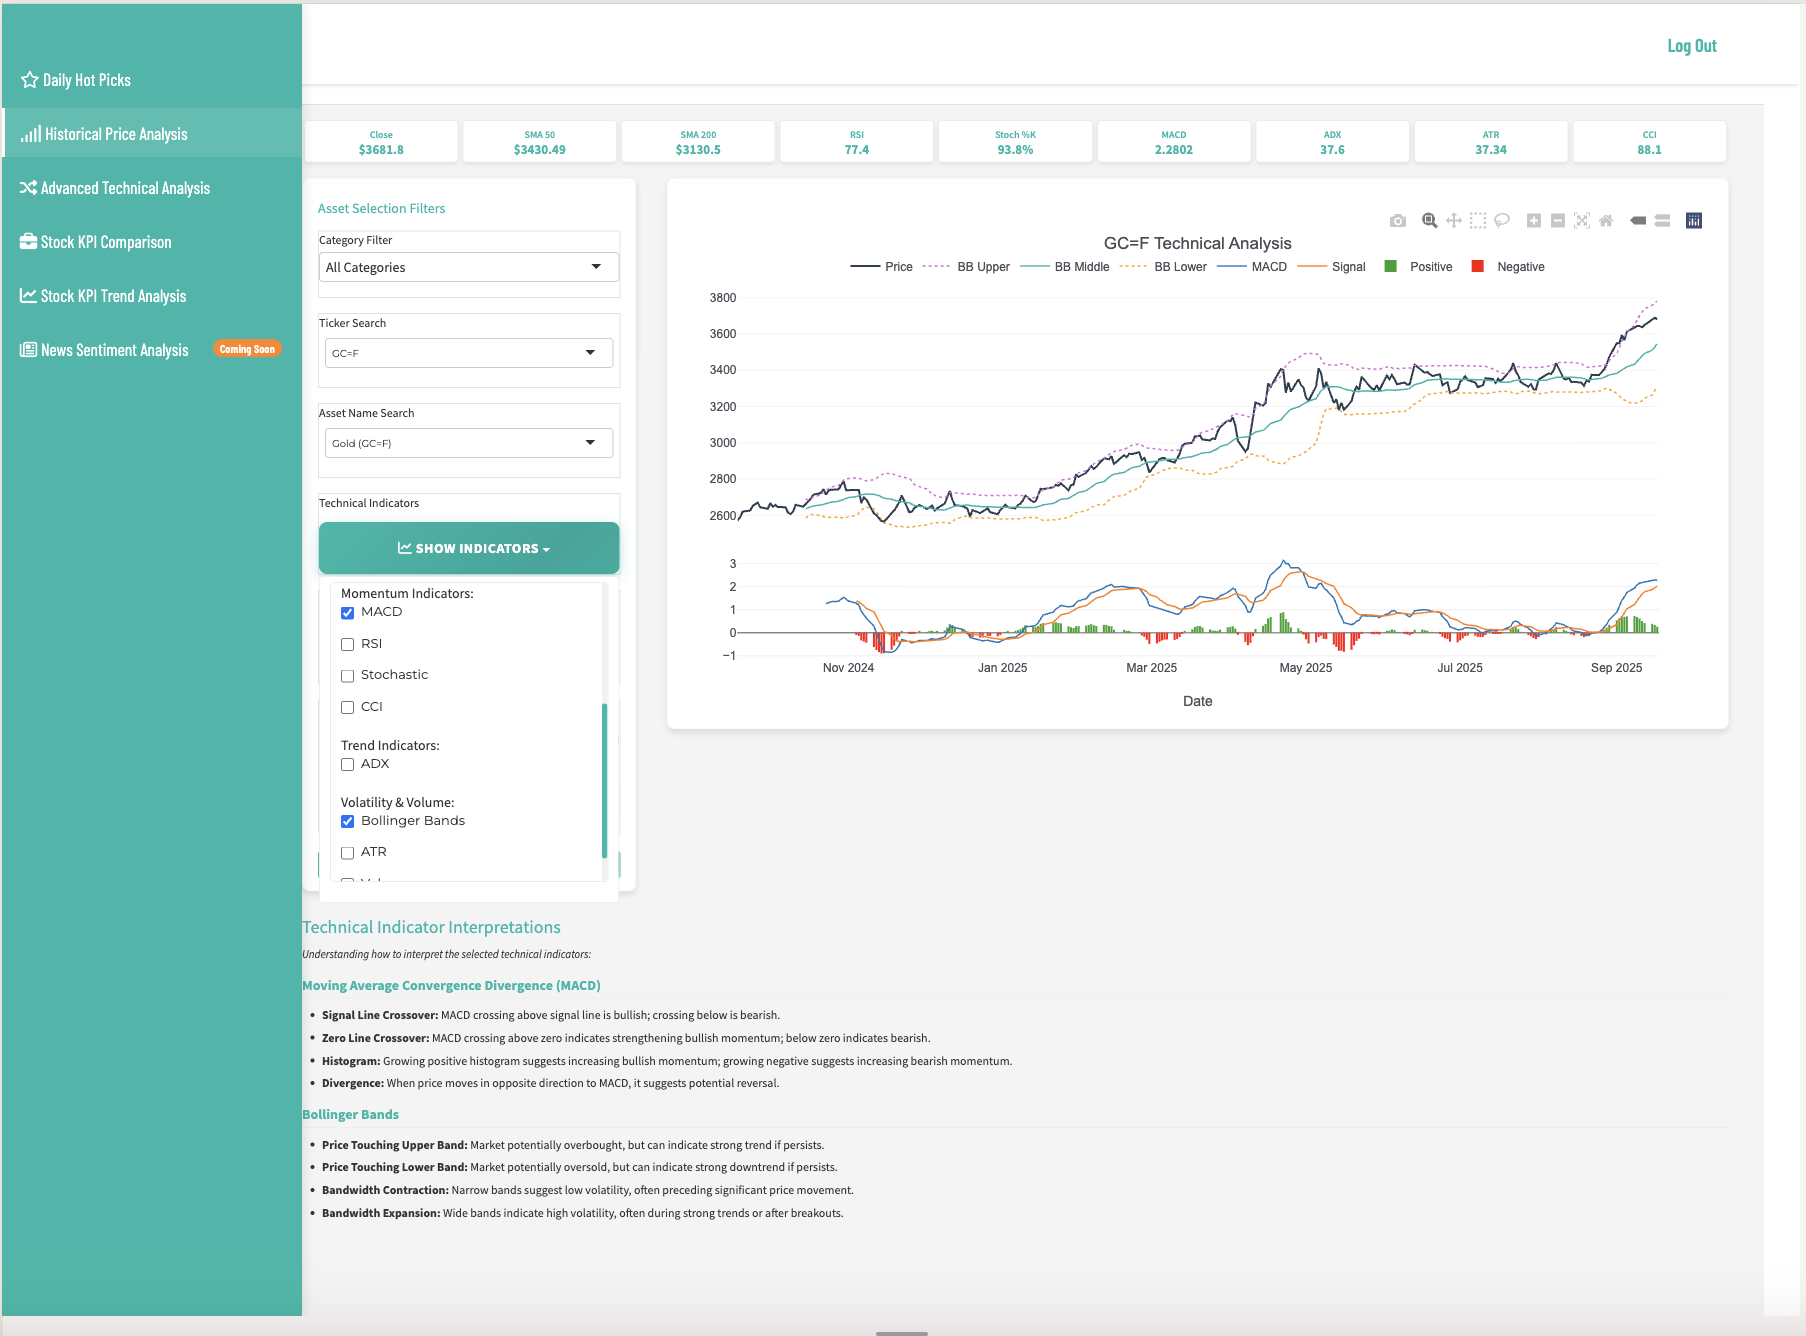
When an asset catches your attention from the Daily Hot Picks, InvestMuse’s Historical Price Analysis takes you deeper. This isn’t your typical charting tool, it’s a comprehensive technical analysis laboratory.
Select from multiple asset categories (stocks, metals, FX pairs, cryptocurrencies, commodities, indices, and market indicators), then overlay sophisticated technical indicators:
Momentum Indicators: SMA, EMA, MACD, RSI, Stochastic, CCI
Trend Analysis: ADX for trend strength identification
Volatility Measures: Bollinger Bands for market volatility assessment
The interactive interface lets you customize time frames and indicator combinations, transforming complex technical analysis into intuitive visual insights.
The Quantitative Edge: Advanced Technical Analysis
Here’s where InvestMuse truly differentiates itself from mainstream platforms. The Advanced Technical Analysis section employs cutting-edge mathematical models that were previously exclusive to hedge funds and institutional investors.
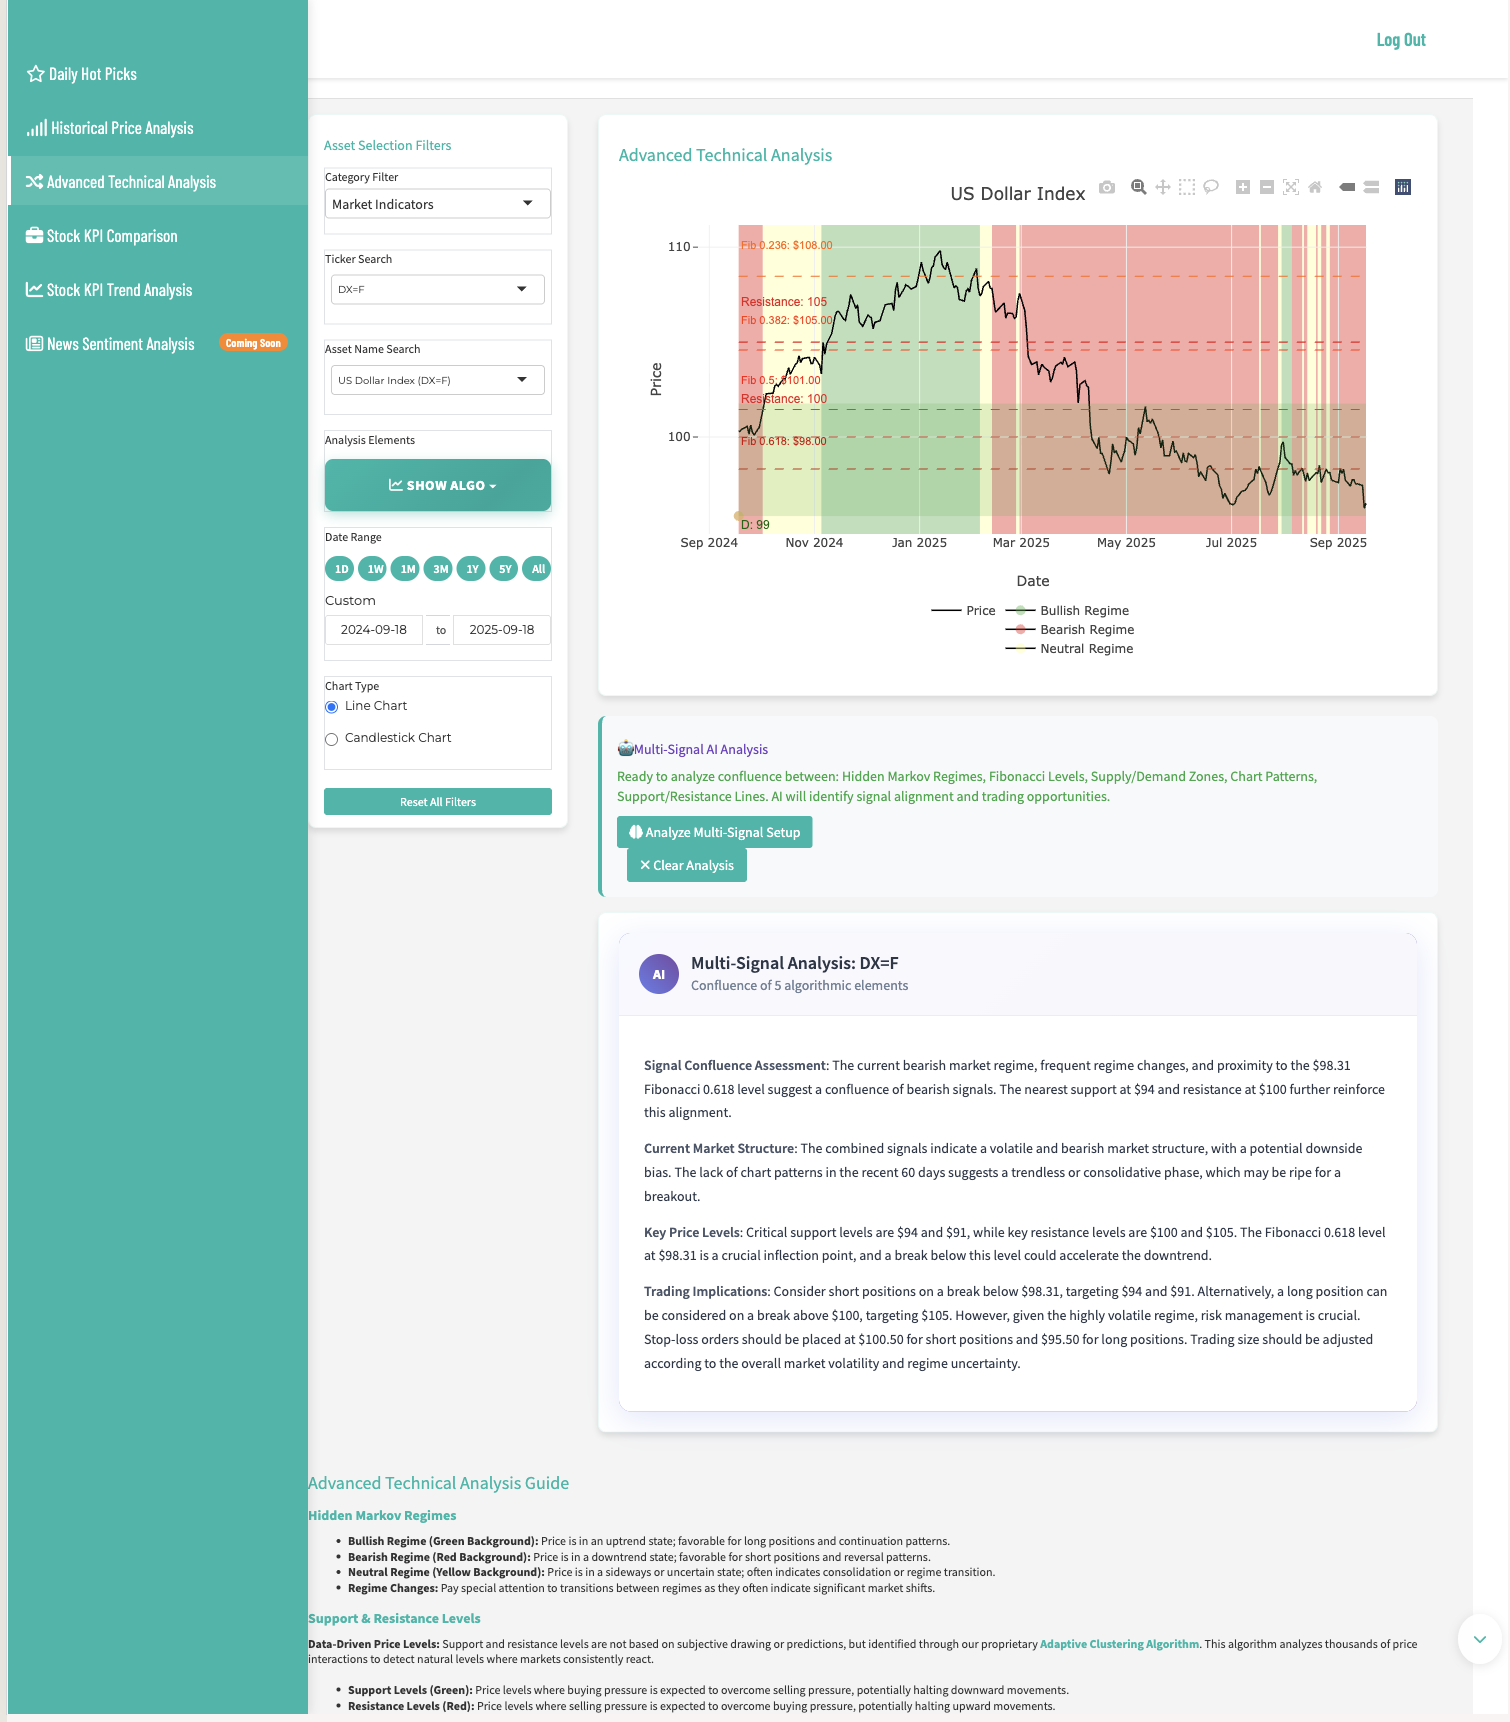
Hidden Markov Models: The Market’s Secret States
Traditional technical analysis relies on human interpretation of chart patterns. InvestMuse’s Hidden Markov Models automatically detect market regimes periods when the market behaves according to different underlying patterns:
- Bullish Regimes (Green zones): Favorable conditions for long positions
- Bearish Regimes (Red zones): Favorable conditions for short positions or defensive strategies
- Neutral Regimes (Yellow zones): Sideways markets requiring different approaches
These aren’t subjective interpretations, they’re mathematically identified market states that help you align your strategy with prevailing conditions.
Revolutionary Financial Visualization
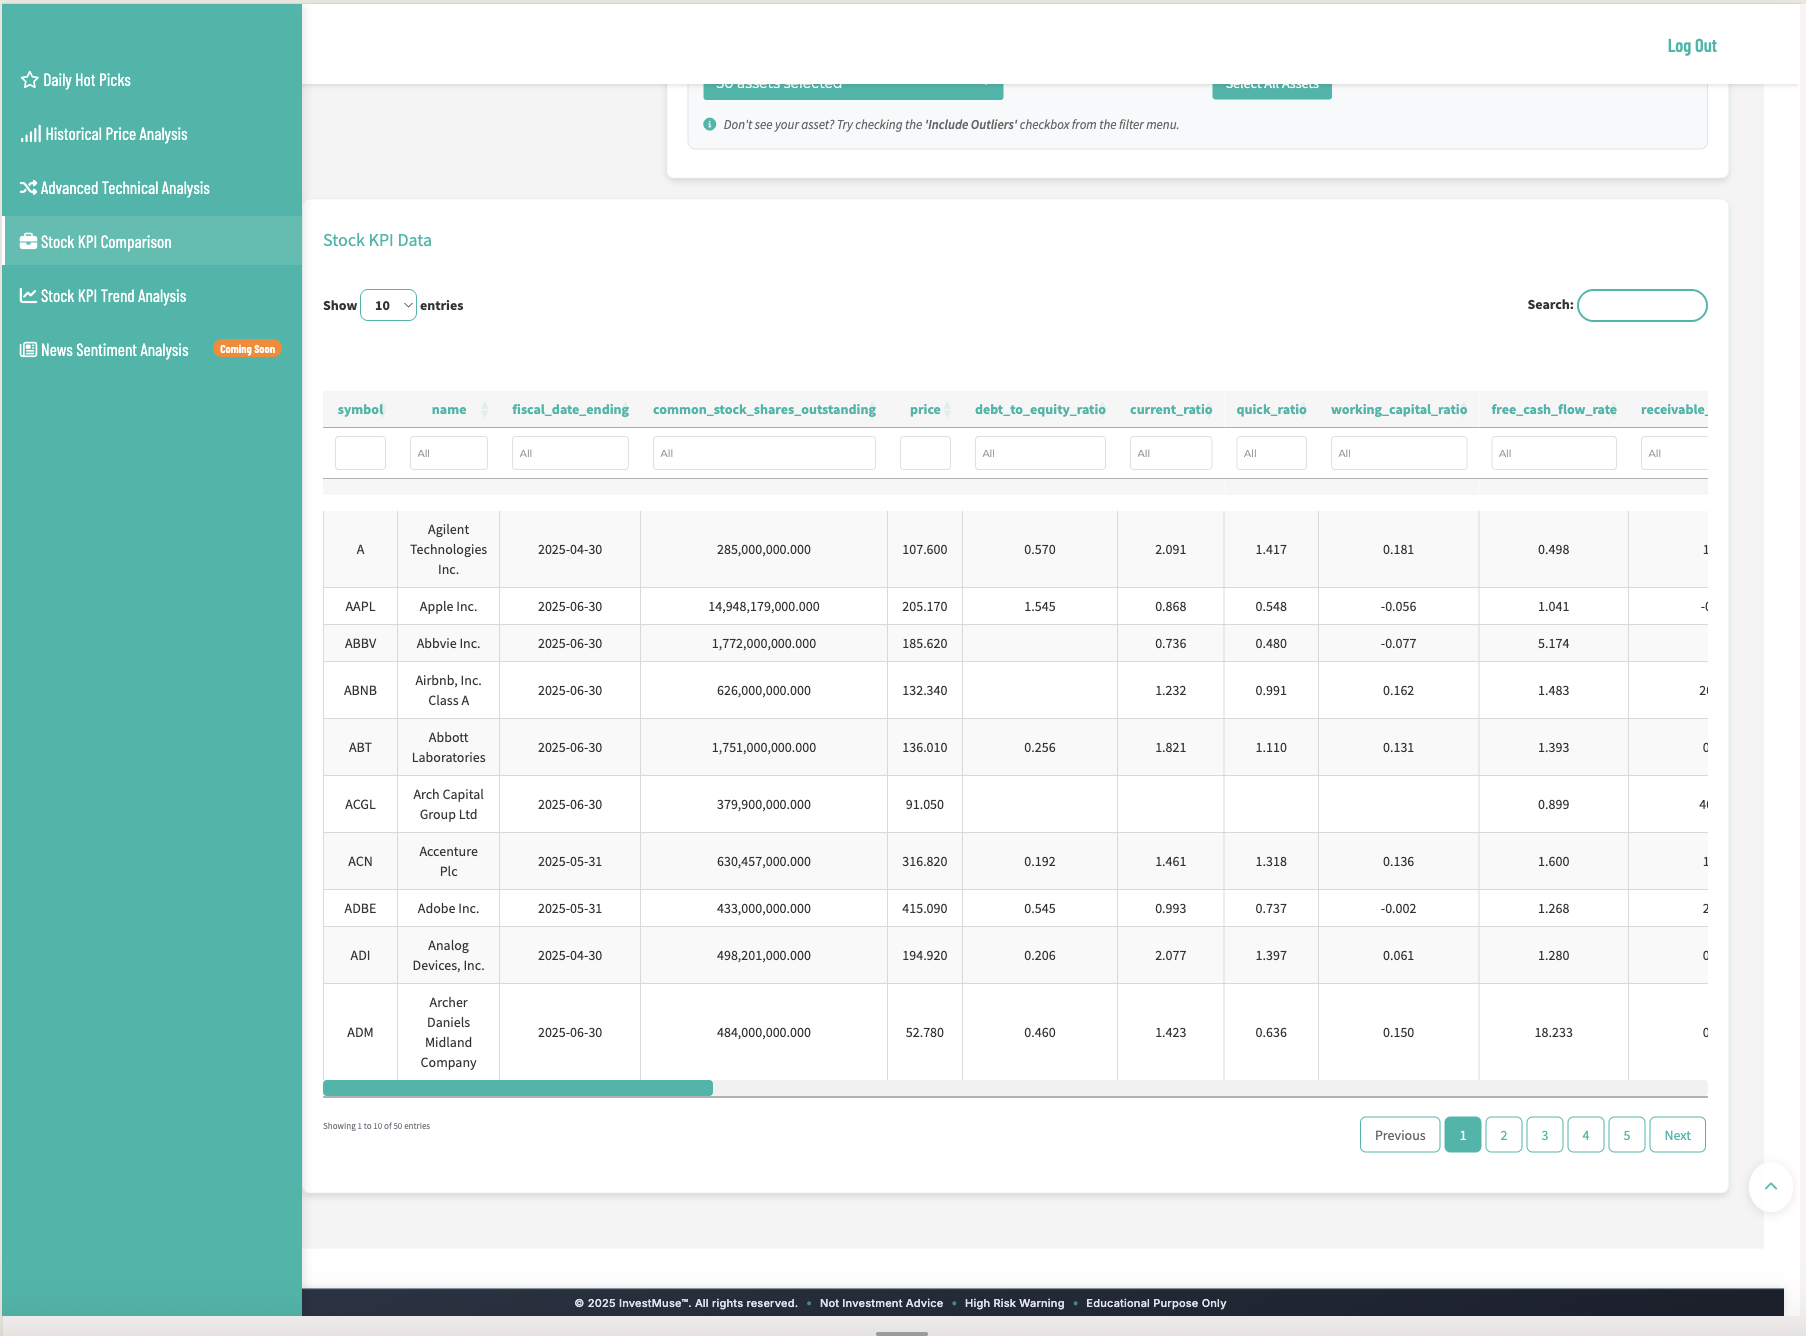
Most investors struggle with fundamental analysis because financial statements are complex and comparing companies requires significant expertise. InvestMuse solves this with its groundbreaking Stock KPI Quadrant Analysis.
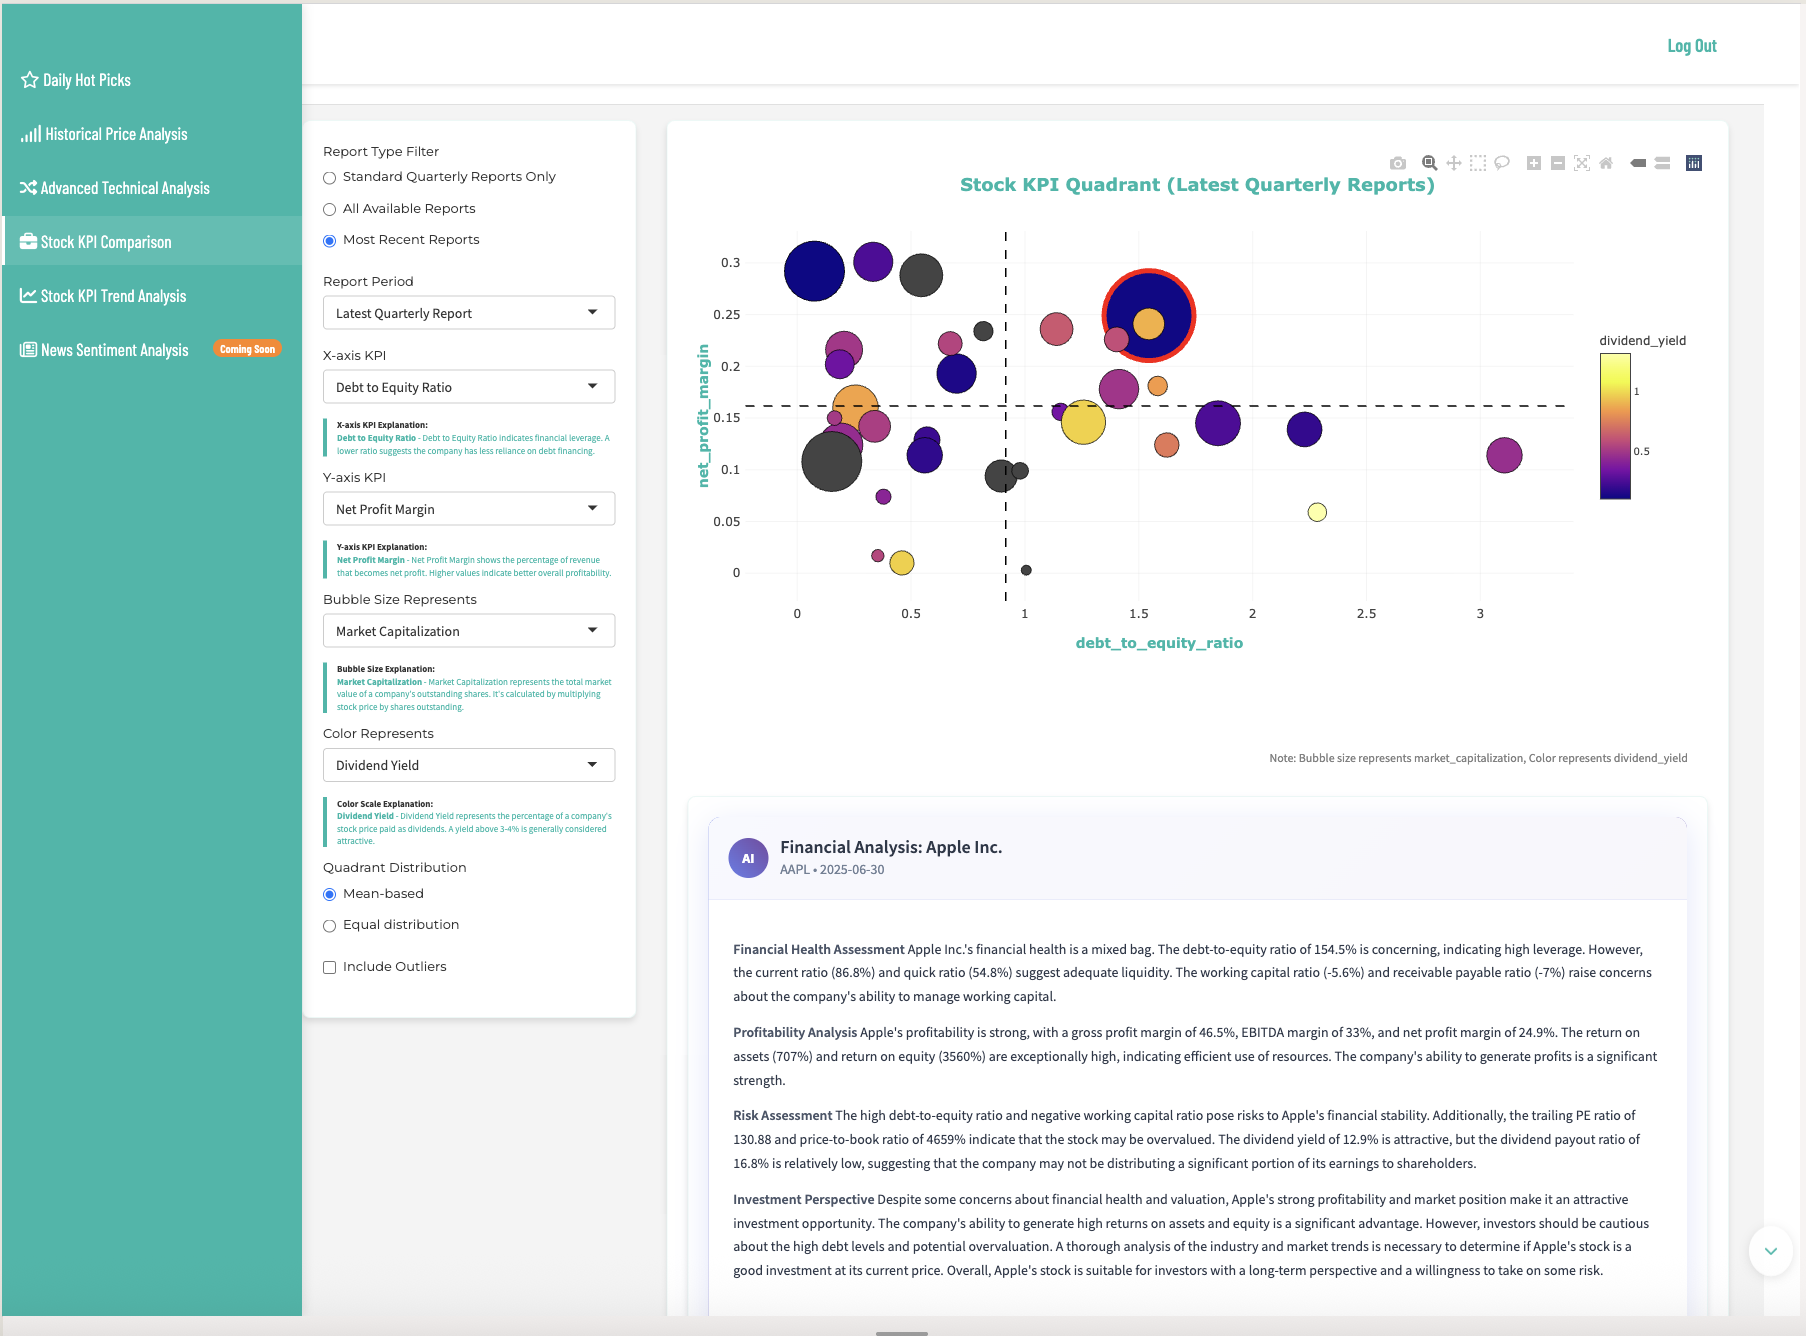
Your Financial X-Ray Vision
Imagine seeing dozens of stocks simultaneously across four dimensions:
- X-axis: Debt-to-Equity Ratio (financial leverage)
- Y-axis: Price-to-Earnings Ratio (valuation)
- Bubble Size: Market Capitalization (company size)
- Color: Performance indicators
This 4D visualization instantly reveals undervalued companies in strong financial positions, overextended stocks with high debt levels, growth companies with reasonable valuations, and market leaders vs. struggling competitors.
AI-Powered Financial Commentary
When you identify an interesting stock on the quadrant chart, InvestMuse’s AI analyst takes over. Click “Get AI Commentary” and receive a comprehensive financial health assessment that rivals professional analyst reports.
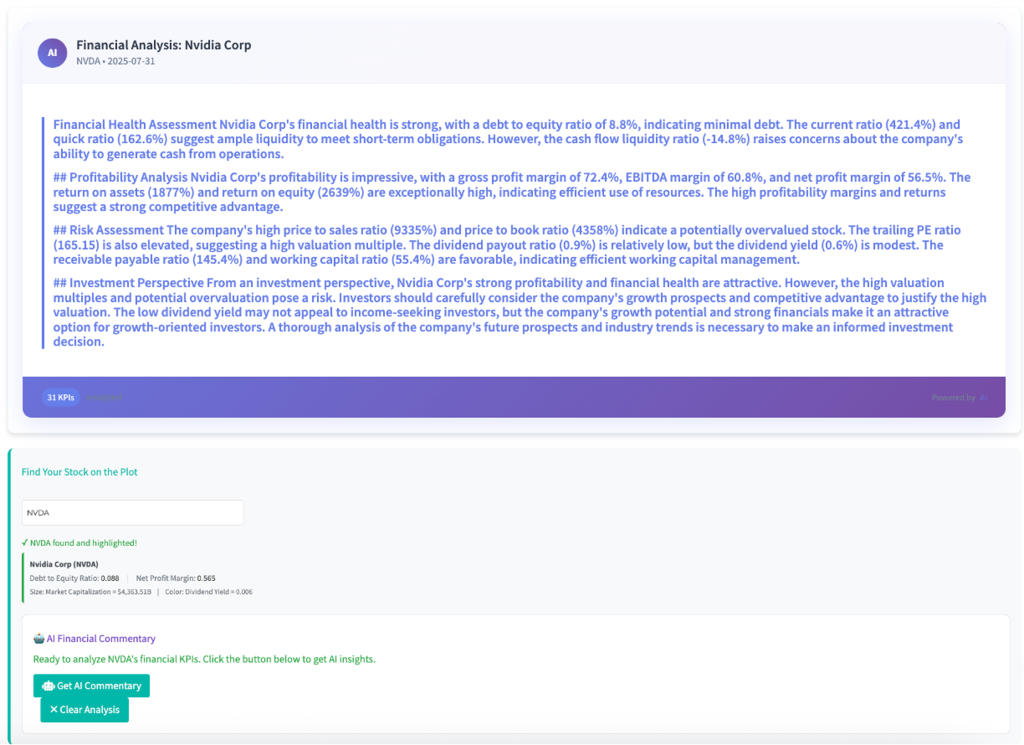
The AI commentary includes financial health assessment, profitability analysis, risk assessment, and investment perspective with specific considerations.
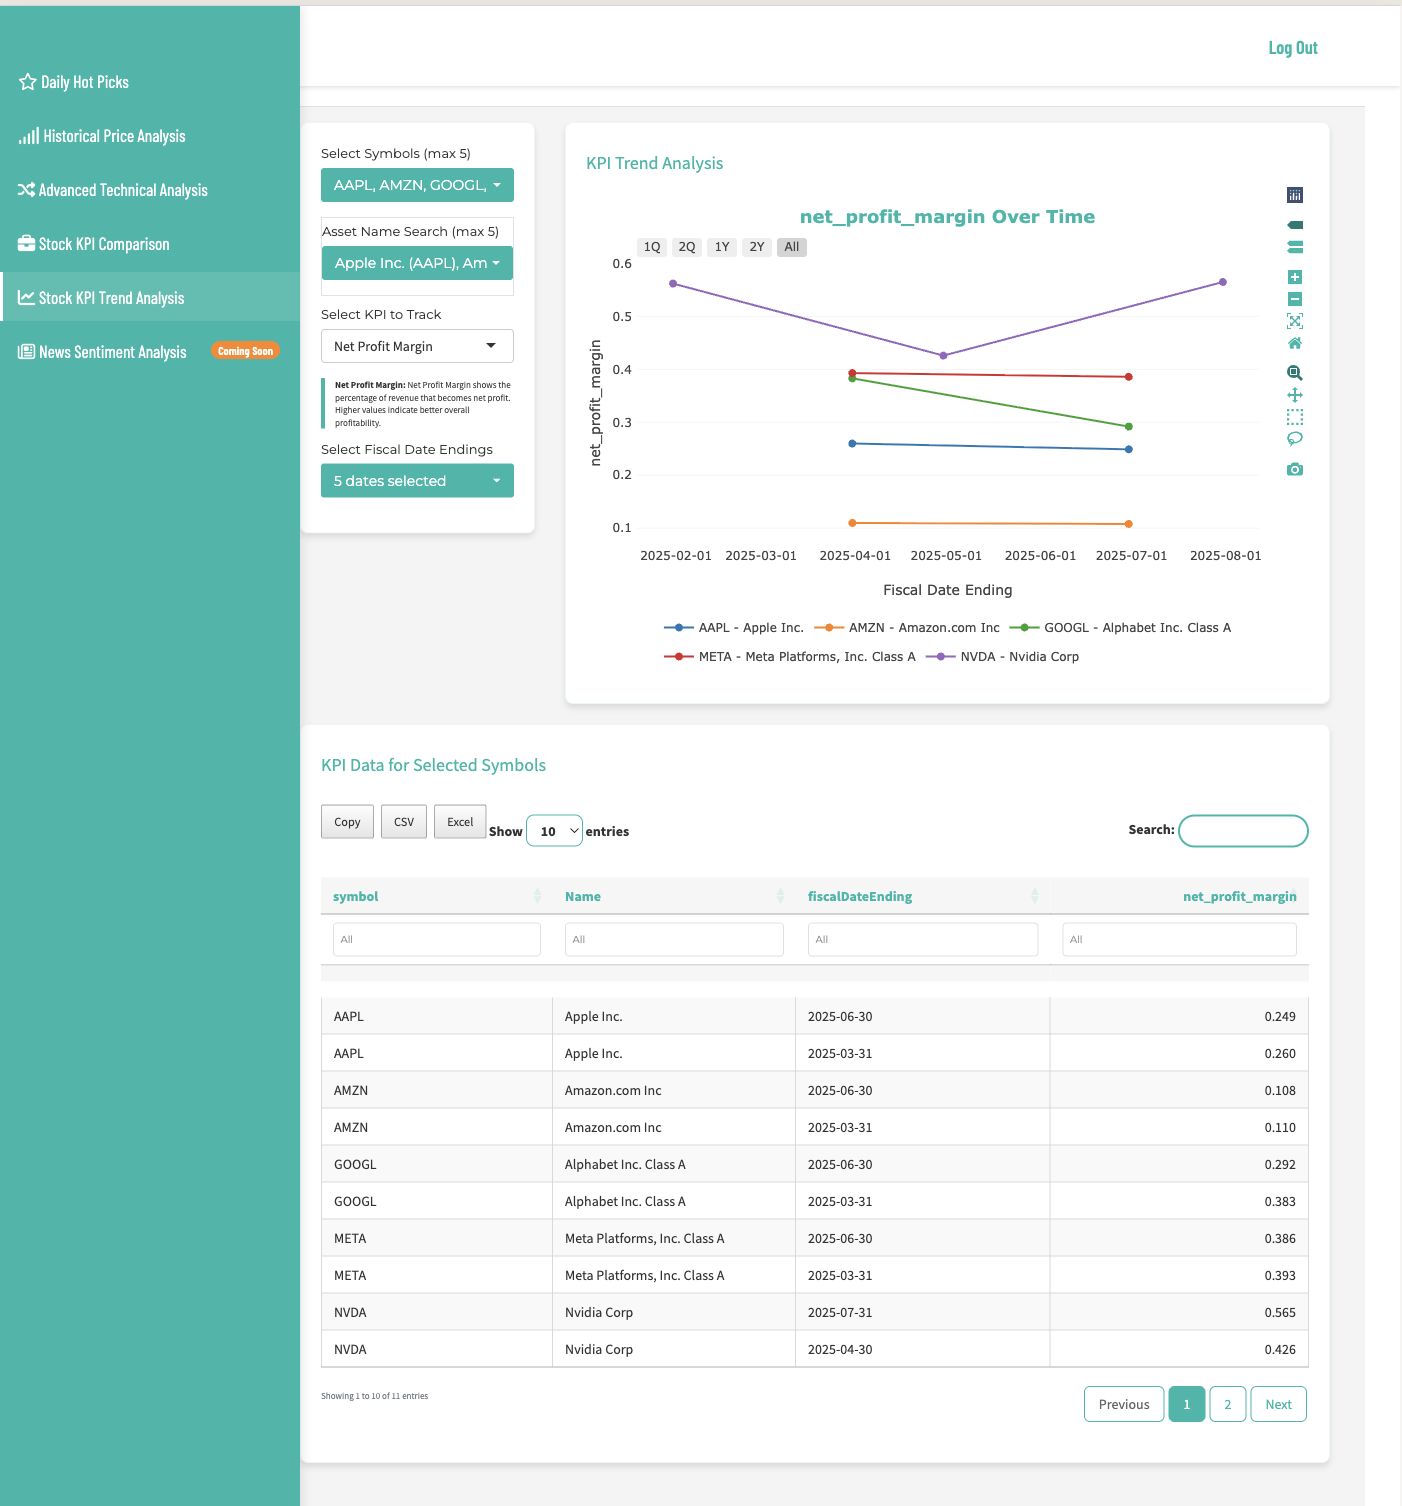
Track Performance Over Time
Static analysis only tells part of the story. InvestMuse’s Stock KPI Trend Analysis reveals how companies’ financial metrics evolve over time, helping you identify improving or deteriorating business fundamentals.
The InvestMuse Advantage
InvestMuse isn’t just another investment tool, it’s a complete analytical ecosystem that transforms how you research, analyze, and make investment decisions. The combination of AI-powered insights, advanced mathematical models, and intuitive visualization creates a genuinely differentiated investment experience.
Ready to experience investment analysis as it should be? Start your journey with InvestMuse and discover how technology can enhance your investment decision-making process.
InvestMuse: Where institutional-grade analysis meets intuitive design, empowering every investor with the tools to make confident, data-driven investment decisions.